A Complete Report of Your Event Activity
Analyze as much strategic data as possible
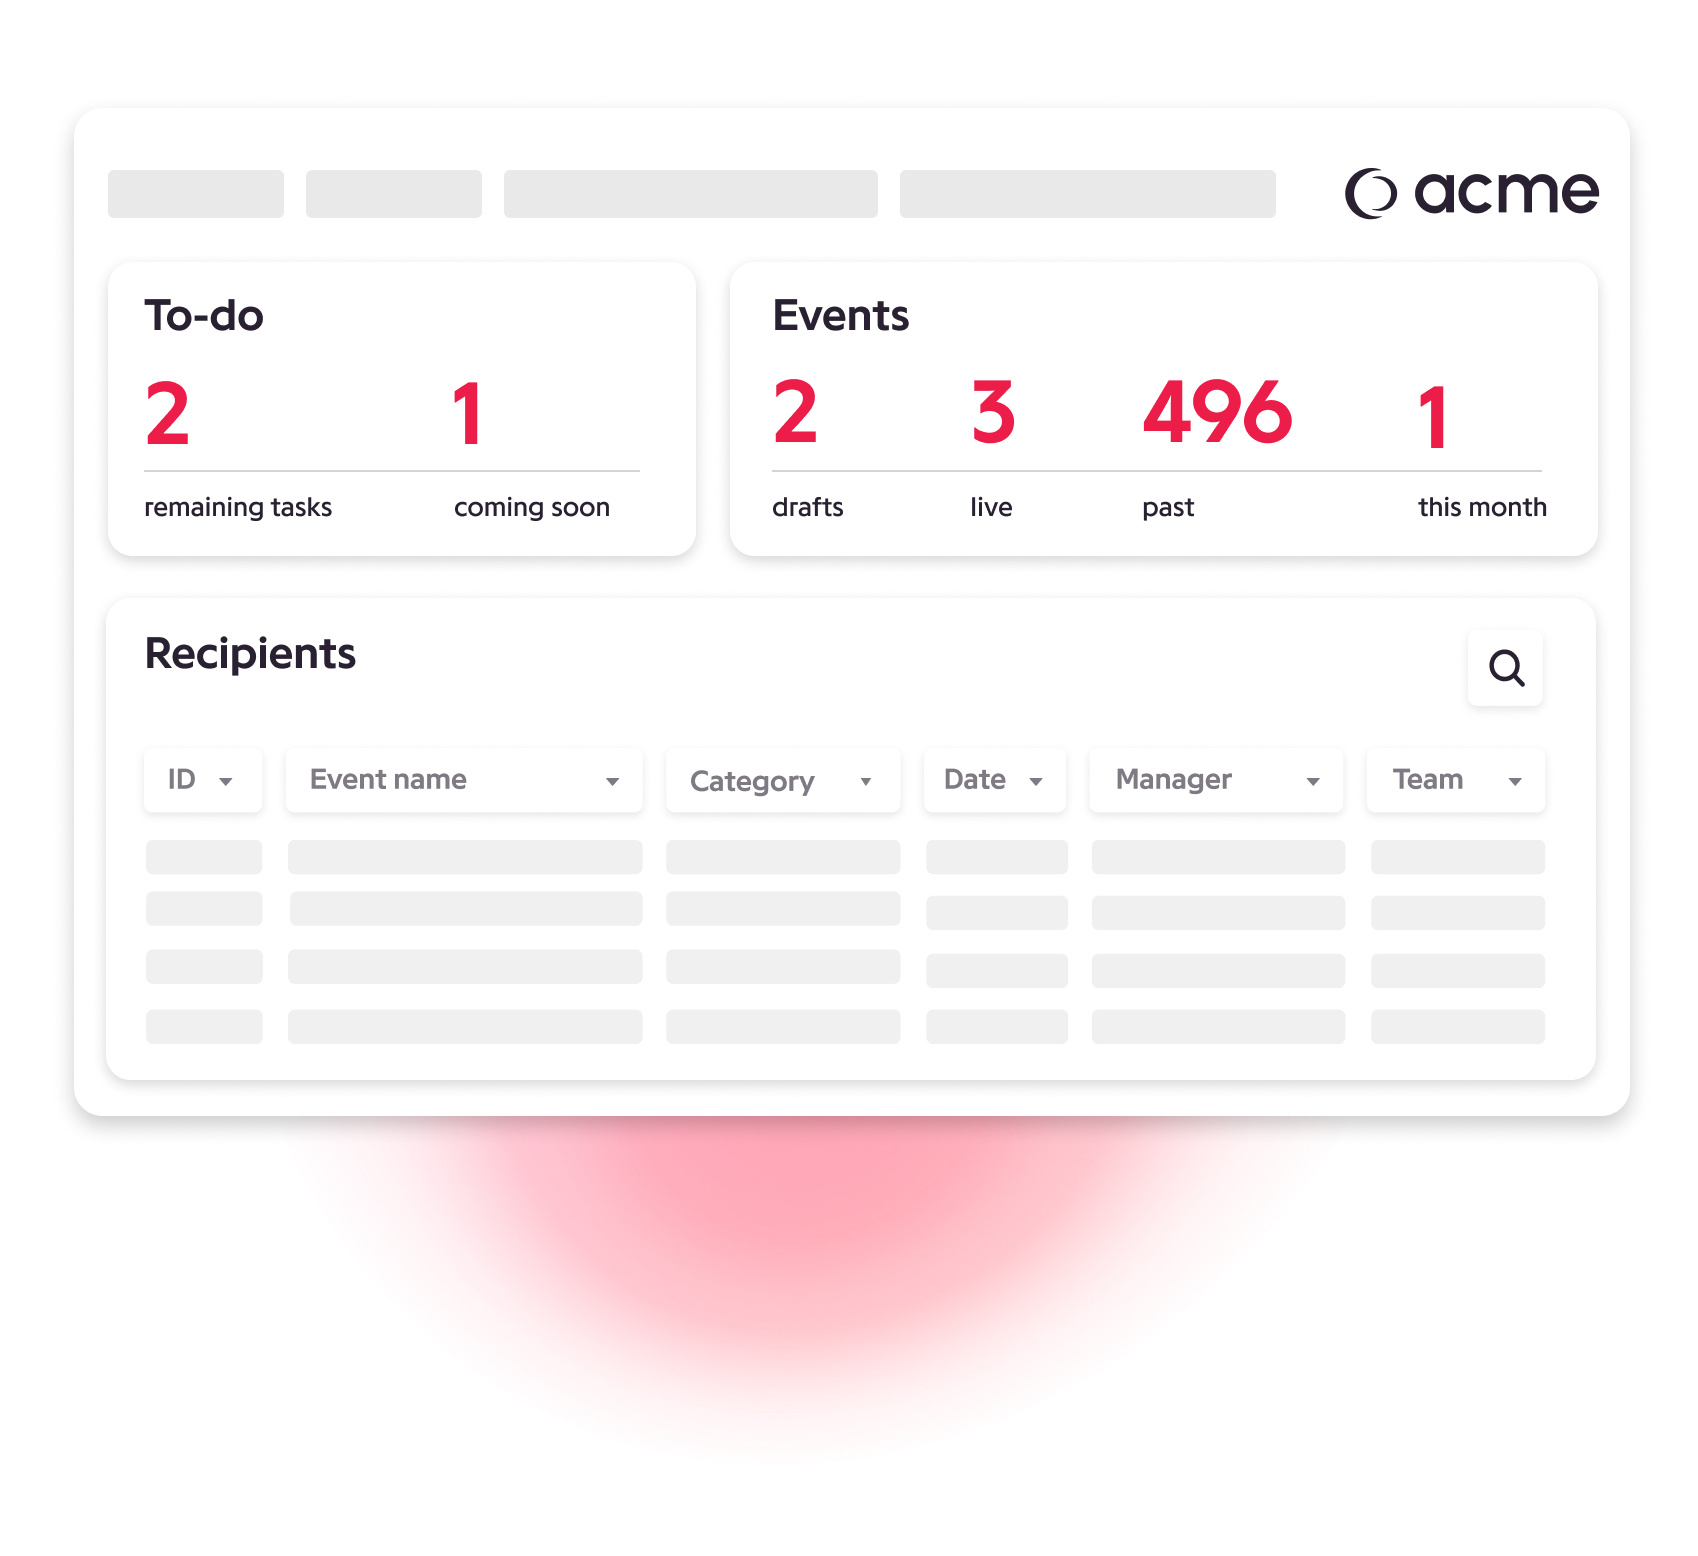
Eventdrive’s event management platform provides a comprehensive and detailed overview of your entire event activity (by event, category, teams...). This solution offers total transparency on the performance and impact of your actions.


Access key data of your organization
List of events over a given period
List of events organized by team
Events in preparation
Events scheduled for this month
Turn Numbers Into Strategic Opportunities
Real-Time Data
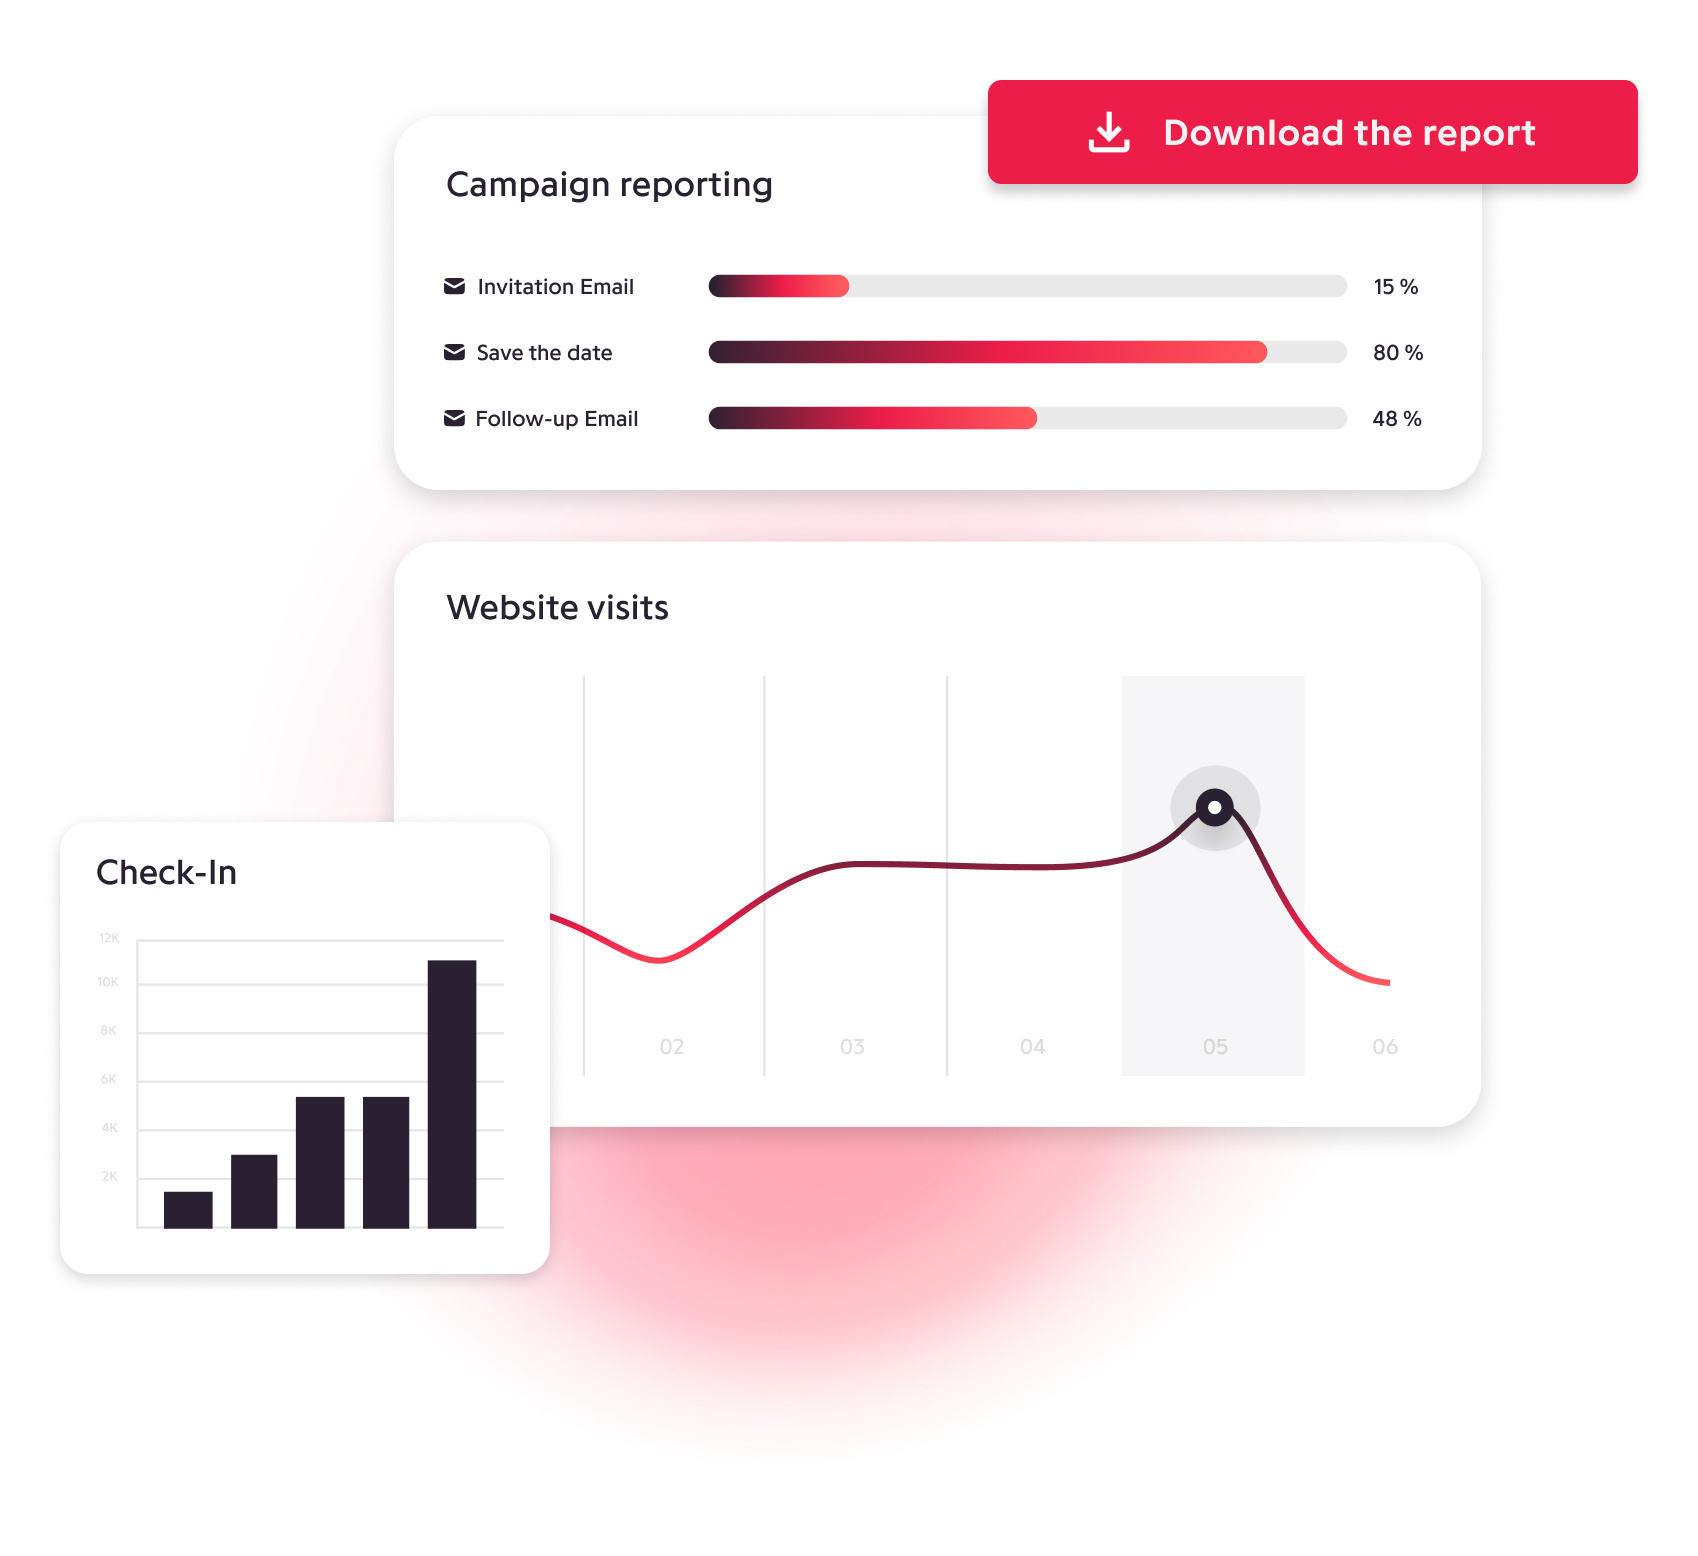
Get an instant view of the performance of your event actions (emailing KPIs, website visits, most popular interactivities on the day...). This makes it easier to make strategic decisions, adjust plans in real time to optimize the participant experience, and quickly detect emerging trends.
A Way to Refine Your ROI
Track your event's return on investment (ROI) to identify successes and areas for improvement. This allows you to better focus your efforts and optimize your strategy based on the insights gained.
Exportable Reports in One Click
The platform allows you to easily export all reports. Quickly share the results of your actions with your team members, management, and/or external stakeholders, and collaboratively learn from them.
An Optimized Attendee Experience
Enhance your attendees' experience by analyzing their behavior and collecting feedback. With this data, you can refine your event strategy by taking into account their needs, expectations, and preferences.
An infinite source of data to leverage
Event website traffic and visitor tracking (UTM)
Statistics available for your Live Streaming events
KPIs for your campaigns, including attendance and interactivity...
Data visualization (in the form of rings, curves, and histograms)
Survey results and export
Quick export of event reports
Want to simplify the creation of your corporate events?
They organize their events with Eventdrive


.svg.png?width=83&height=67&name=1200px-Assicurazioni_Generali_(logo).svg.png)


.svg.png?width=800&height=188&name=Logo_Helvetia_(assurance).svg.png)


