The Must-Have KPIs to Measure Hybrid Event Performance

Picture it. You’ve just designed your hybrid event thanks to your all-in-one Event Management Platform. Now it’s time to see how you did. To do this, there is nothing better than using those famous KPIs (Key Performance Indicators) to guide you. Here are the must-have KPIs to track your hybrid event performance.
The Key Performance Indicators of A Hybrid Event
We all know this, but it definitely doesn’t hurt to remind ourselves that the KPIs used to track the performance of any event are relevant to the objectives set at the very beginning. We have previously recommended in our article dedicated to measuring the KPIs of a virtual event the SMART method to define your event objectives. It’s the best way to make sure your event design is on target ensuring optimal performance.
Comparing your hybrid event performance to past events
Before we detail the main KPIs to measure your hybrid event’s success, we’d like to mention that you can always go even further in your analysis by comparing your results to those of your past events. In doing so, you will be able to see the difference in performance between multiple event formats: in-person, virtual or hybrid. Perhaps one format works better than another depending on the type of event.
Hybrid Event Registration KPIs
Number of registrants
It is important to have a precise view of the total number of registered attendees especially for a hybrid event where flawless logistics play a huge role. It’s important to know exactly how many will participate virtually and how many will be present on site.
Registration rate
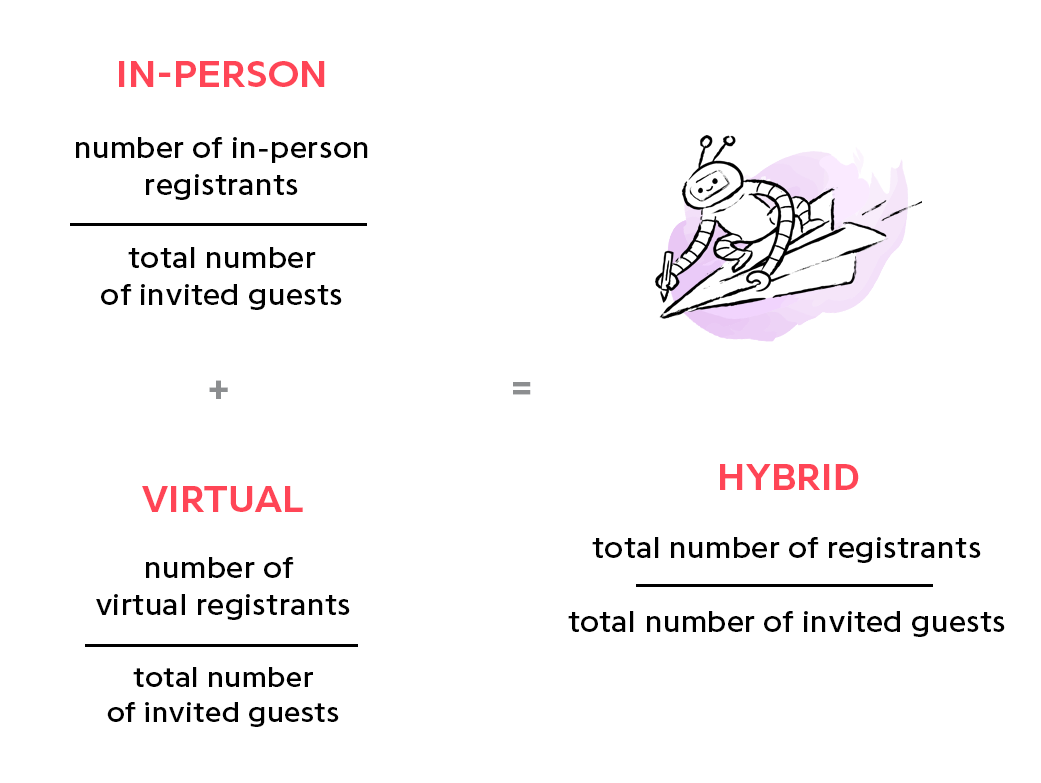
The number of registrants and the number of guests are the key figures for calculating your registration rate, which is calculated by dividing the number of registrants by the total number of invitees.
In order to have better visibility of the performance of a hybrid format, we recommend that you differentiate the rates between the online and in-person version. Your hybrid event’s registration rate will be the sum of the two.
Hybrid Event Participation KPIs
Total number of participants
Generally speaking, between 40% and 50% of registrations will actually be present, whether online or in-person, the day of your event. Since a hybrid event allows participants to choose the event format that best suits them, you’re able to push the participant experience even further. In opting for a hybrid format, you can expect to see even higher registration rates.
You’ll need to know the total number of attendees present at your event and the breakdown of both your virtual and in-person participants to calculate your participation rate.
Participation rate
The number of participants checked-in and the number of registrants are the figures used to calculate the participation rate for your hybrid event. The rate is calculated by dividing the total number of participants by the total number of registrants.
For a more detailed view of your hybrid event performance, differentiate between online and in-person rates as mentioned above.
Time spent on your virtual event
There are other KPIs that may be of interest when measuring the performance of your hybrid event. In particular, the average time spent on your virtual event space.
The viewing time is a measure used in television broadcasting. If you think about it, watching a virtual event is almost like watching a show on TV, but with a more active participation. You have to deliver a participant experience à la Netflix to keep them wanting more. Have you captured their attention? Were the topics covered interesting enough? The average viewing time of the online version of your hybrid event is a great way to know if the participant experience you designed delivered.
- Total minutes spent in the virtual event space / Number of online participants checked in.
Average time spent per session
The average online viewing time of a hybrid event can also be calculated per session. Which sessions were the most successful? How long were your participants active in each session? Calculating the average time spent in each session will help have a more detailed breakdown of your event’s success.
- Total minutes of viewed streaming of session / Number of online participants checked-in.
Time means by plenary:As with sessions, you can analyze the influence of your plenary on your guests.
- Total number of minutes of streaming / Number of registered participants in the room.
Total Streaming Minutes: How much time did your attendees spend at your online event in total? This large number is a nice-to-have to add to your reports and definitely will make an impression.
- Total number of minutes spent in all sessions and plenaries, all participants included.
Hybrid Event Engagement KPIs
Number of participants engaged
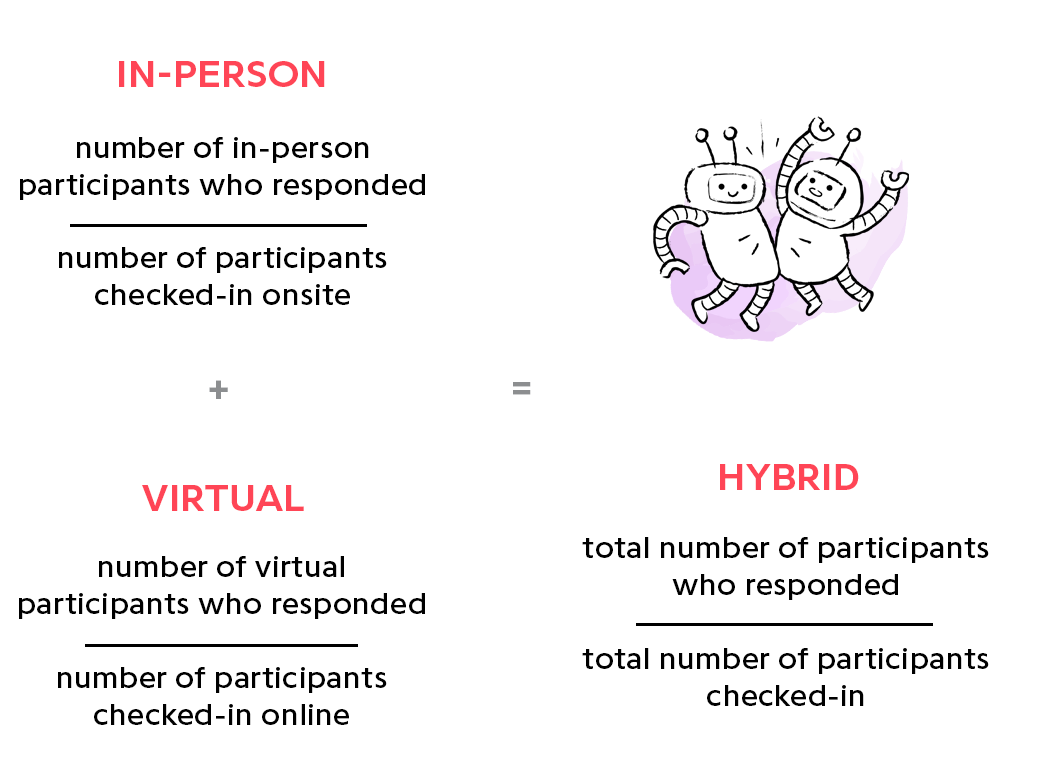
Your participant engagement KPIs are based on the number of people who responded to an interactivity (chat, poll, survey...) during a hybrid event compared with the total number of participants present. If you use an event application for your on-site participants and a Virtual EMS with interactive services included it’s much easier to track these KPIs.
To calculate the total number of participants engaged, you’ll need:
- The number of participants who actively participated online.
- The number of participants who actively participated on site.
Engagement rates
For most Event Planners, the engagement rate is the ultimate indicator of an event’s success and of course this KPI shouldn’t be left out when measuring your hybrid event’s success. The hybrid engagement rate is calculated simply by dividing the total number of participants, both online and in-person, who responded to an interactivity during your event by the total number of participants present.
Live chat engagement rate
Chats have become essential to the participant experience at online events. Or course, you can always opt to deactivate the chat functionality for your event, but we don’t recommend this. Offering your participants a chat is another way to engage with them. When we engage, we track so your live chat should also be taken into account in your hybrid event reporting. You’ll want to take the number of people who wrote a message at one point in the chat and divide this by the number of online participants. You can also note the total number of messages sent in your final report.
- Number of people who wrote a message / Number of online participants
- Total number of messages sent
Satisfaction survey engagement rate
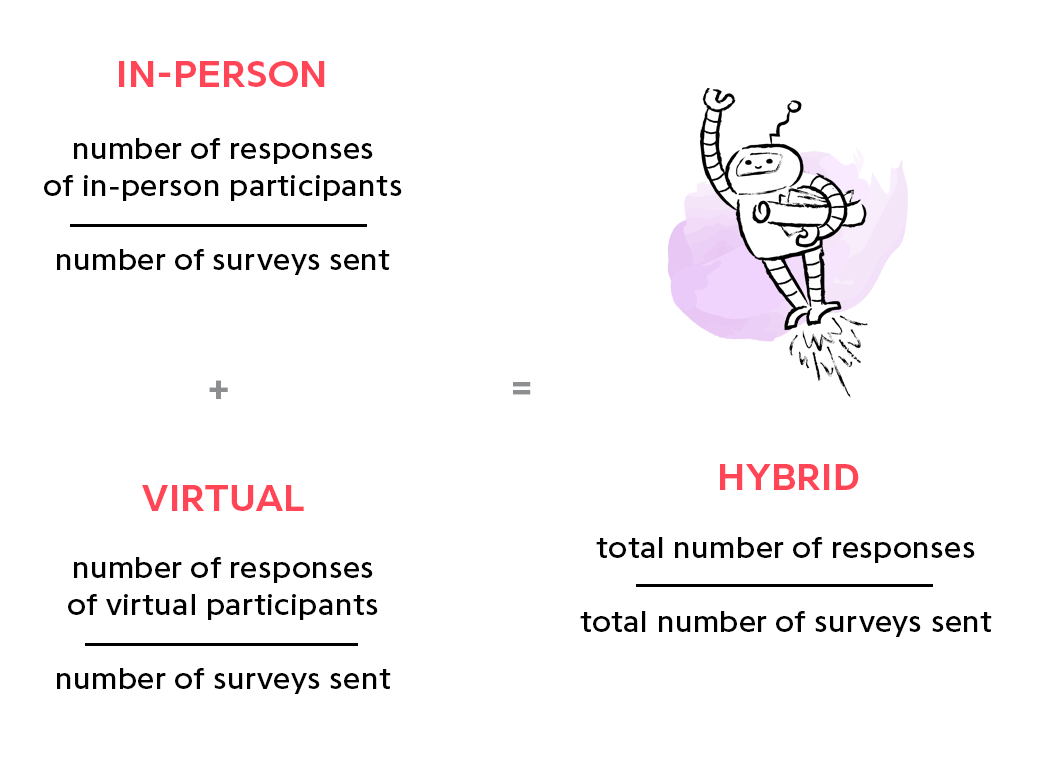
The number of responses and the number of surveys sent are the two essential indicators to measure the response rate to your satisfaction surveys. Surveys are a powerful means to engaging participants and can help shape the participant experience.
The response rate for satisfaction surveys is calculated by dividing the number of responses received by the number of surveys sent. As for a hybrid event, as previously mentioned, you’ll want to take into account the total number of responses for both in-person and online attendees and of course the breakdown by format.
Hybrid Event ROI
If your hybrid event’s objective is lead and revenue generation, the Event ROI is a key indicator of success. Is your event profitable? Sometimes revenue isn’t generated the day of so you’ll want to first take into account the number of leads qualified by your sales team. You can also take into account the total number of business opportunities generated and of course their value. Tracking this type of event’s performance is done over time to officially understand the event ROI. Working closely with your sales team is key to measuring your hybrid event’s ROI.
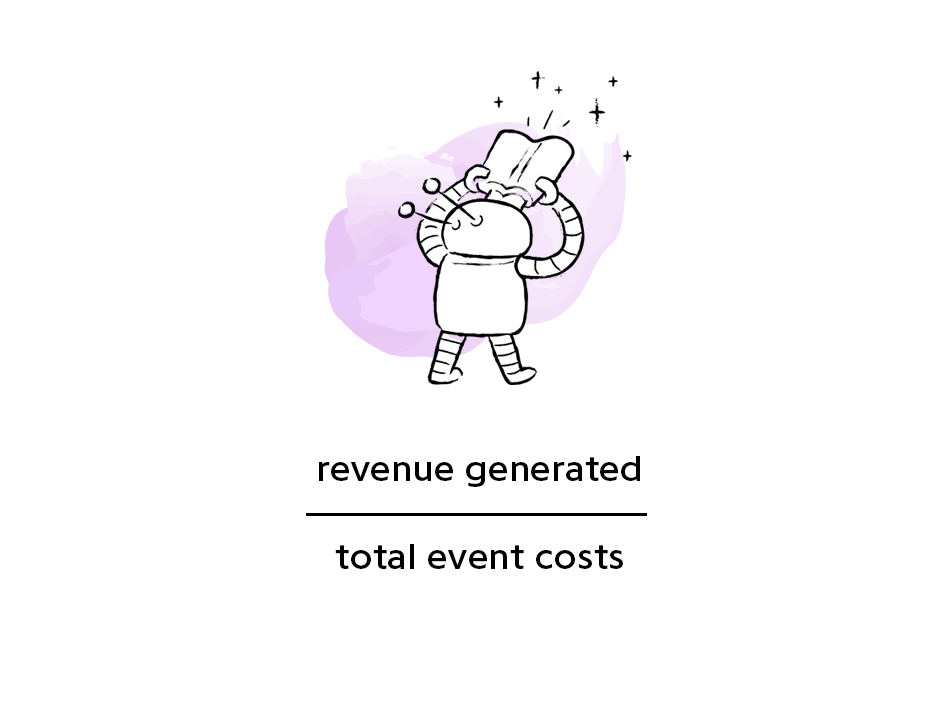
To calculate the official ROI of your hybrid event, you’ll want to divide the total amount of revenue generated thanks to this event by the total cost of your event.
The budget-friendly side of hybrid events
Optimizing your hybrid event ROI is all about optimizing costs. Hybrid events have now become a must for major corporations. Why? Not only are event planners able to reach a wider audience and design tailored participant experiences, but they are able to optimize their event budget.
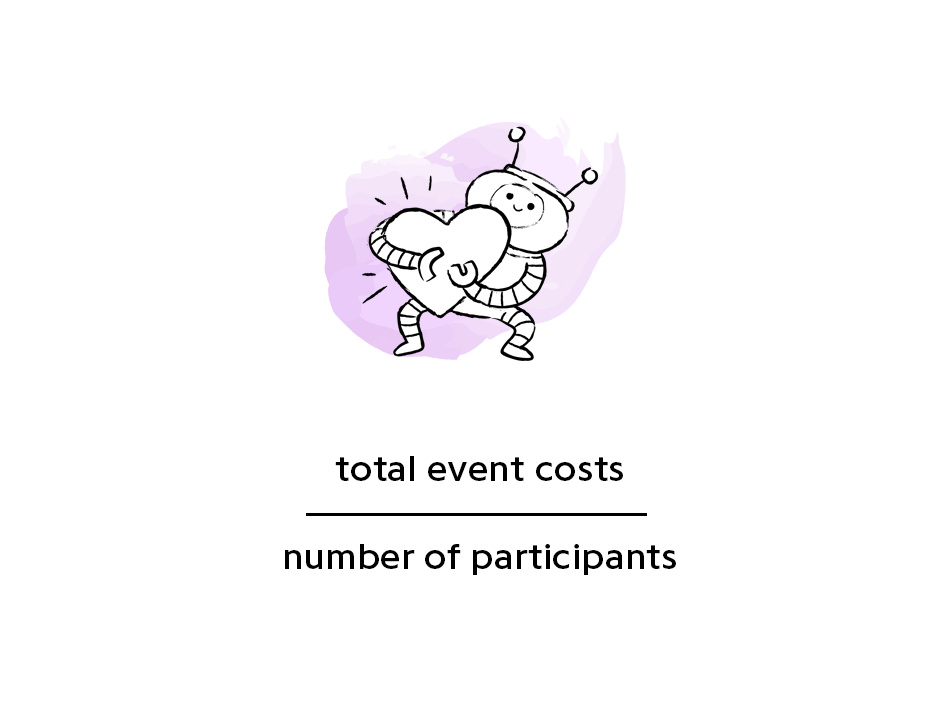
To find out if a hybrid event is the best format for you, we recommend that you compare the cost per attendee to past events. See if there's a difference between the different types of events. Perhaps hybrid sales kick-offs are better than 100% in-person events.
Now you know all the key performance indicators of a hybrid event. Of course, there are other factors that can be taken into consideration such as event attrition rates, which thankfullybcan be reduced if you use an EMS to optimize your event marketing with automated reminders. You can also monitor your event’s success on social media. The point is to always look for ways to measure success to help you improve your event performance.
If you’d like to create a hybrid event on Eventdrive with the help of an expert, schedule a personalized demo.
- Tips (19)
- Virtual events (18)
- Event planning (14)
- Event communication (13)
- Hybrid events (12)
- Event Performance (8)
- Attendee experience (7)
- Seminars (7)
- Eventdrive (6)
- Other (4)
- Year-End Party (4)
- Conferences (3)
- ERG events (3)
- Invitation Management (3)
- Logistics Simplification (3)
- Post-event management (3)
- Team Building (3)
- Event Security (2)
- Event application (2)
- Event trends (2)
- In-person events (2)
- Product Launches (2)
- ROI (1)
- Registration management (1)