KPIs to Measure the Success of a Virtual Event

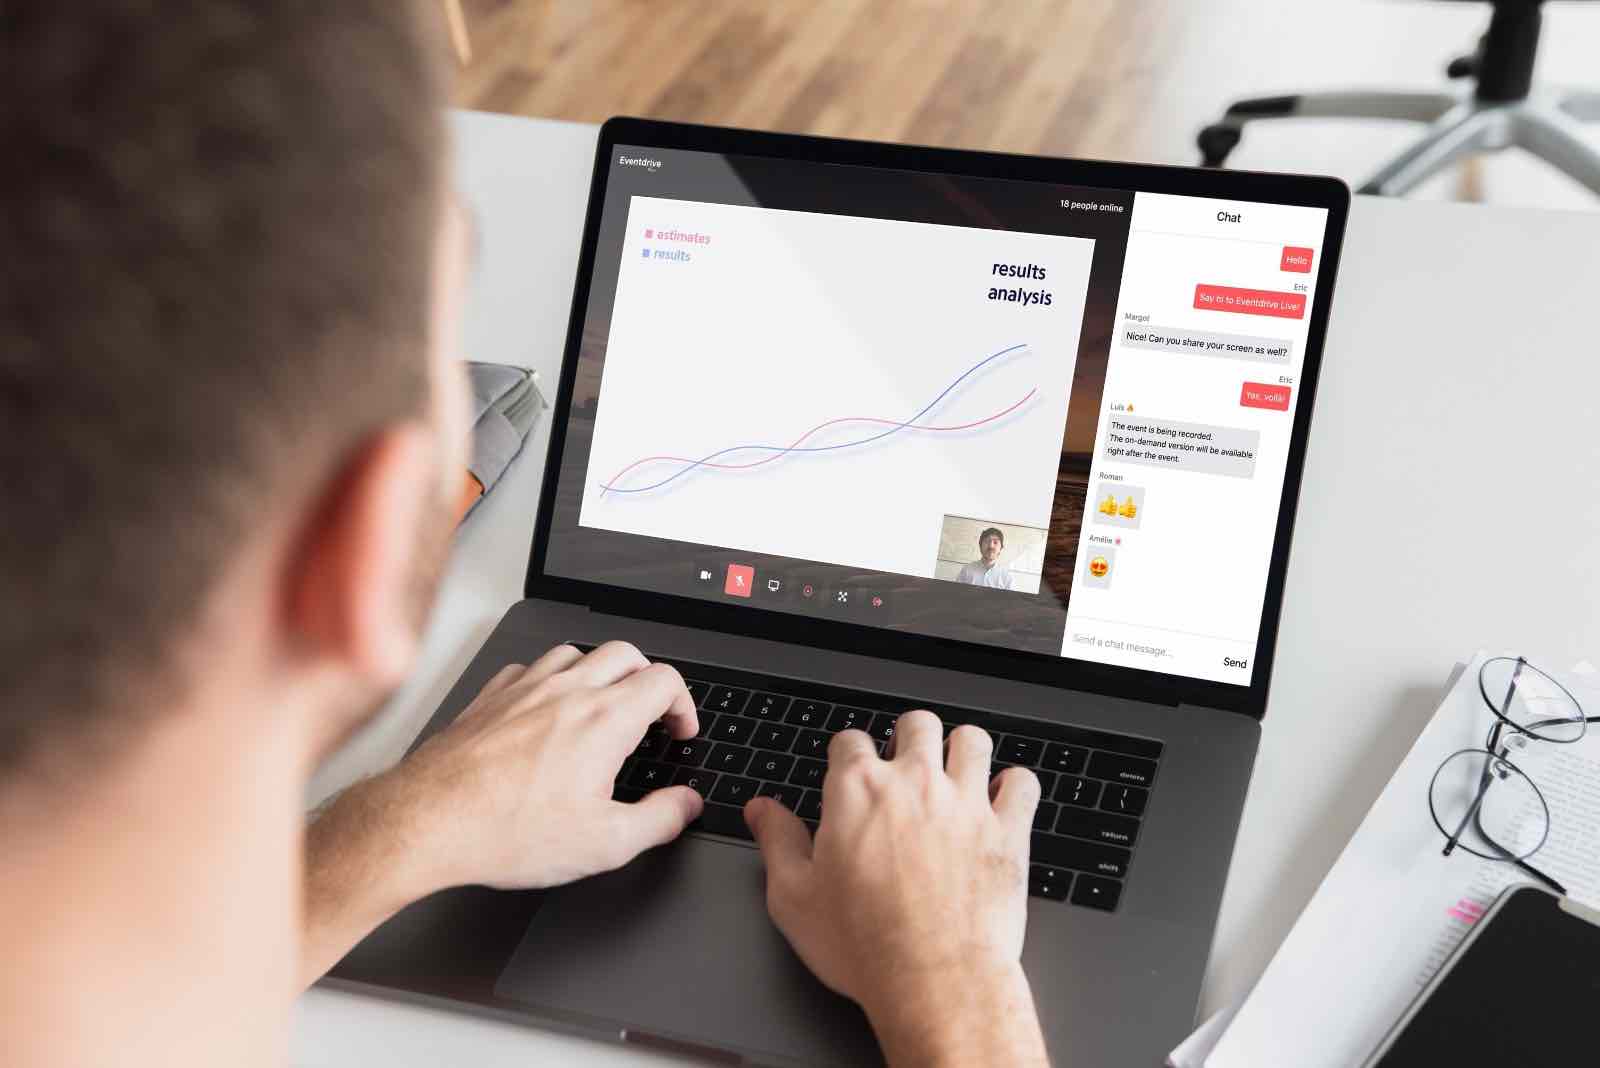
That's it, the big day has arrived! You've created your virtual event for the first time with Eventdrive Live, it was a success and you want more objective data to really see how you did. Yes, organizing a virtual event is great and all, but having numbers is even better!
And for that, what better than specific Key Performance Indicators (KPIs) and relevant statistics to measure the success of your online event at a glance?
Climb onboard and let's take a closer look at which KPIs you should use. 😉
Set SMART goals for your virtual events
First things first! You need to set "SMART" goals. Indeed, an online event without goals is like driving a boat without a heading; you'll move forward, but not necessarily in the right direction. Like every year, the stakes are high and your CEO is counting on you to ensure your corporate event is a hit. It's time to innovate and get everyone onboard with your company's business strategy.
This is perhaps the main power of events: they create contact and interactions with high added value. They allow you to initiate true conversations, which is a real challenge in today's marketing. However, hosting a physical event is out of the question. But you don't just create an event to create an event. You have to know WHY you are going to create a virtual event. How do I set my goals? This is the first question to ask yourself so that your event is consistent with the rest of your strategy. Creating an event is great. Creating a meaningful online event is better. So, whatever your objectives may be, remember that they must be SMART:
- Specific: they are clear, understandable and as precise as possible, even when taken out of context.
- Measurable: they are quantified. Forget the ubiquitous “I must increase my sales” and quantify your objective.
- Attainable: they must be ambitious enough to represent a challenge but without discouraging your team from achieving them.
- Realistic: they must be possible to achieve based on what your team is capable of. Being real with what's achievable based on your ressources will keep you from discouraging the team.
- Time-bound: You have to set a deadline to achieve your objectives. Don't hesitate to divide a main objective into several steps. They can correspond to periods that are easy to identify and remember (example: per week).
Virtual event registration performance
Registration is fundamental and, to effectively measure the performance and attractiveness of your event, essential. It is important to choose the right KPIs to measure from the start. With the right KPIs, you'll be able to quickly identify if your event communication was effective. To do this, we recommend you use these indicators:
- invitation open rate
- click through rate (CTR)
- event website visits
- number of confirmed attendees
- number of participants checked in
You can then use the following ratios to measure your registration performance in detail.
→ Open Rate: emails sent vs. emails opened
For corporate events, you'll want to have an open rate that is higher than 20%. If your open rate is below, this can be due to several reasons:
- The email was marked as spam
- The subject line wasn't relevant enough
- The subject line was too "sales"

→ CTR: clicks vs. emails opened
A great click through rate is above 2%. This corresponds to the number of clicks on links inside your email compared to the number of emails opened. If it is weak, the mail design should be reviewed as well as its structure. For example, are CTAs ("Call to actions" or buttons) placed in the right places? Are the words used relevant and engaging? Are you sharing the right information?To help you create the perfect emailing, discover our templates for your internal seminars.
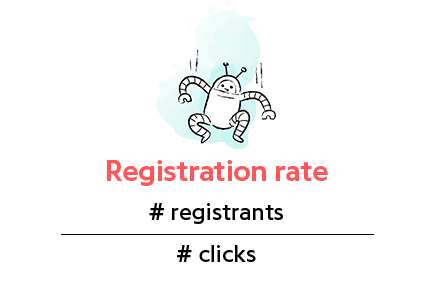
→ The number of registrants / number of clicks ratio
If this is low, it may be that the content of your online event did not match the profile of your guest or that it was not relevant. That's why, you need to build a terrific agenda with quality guests!

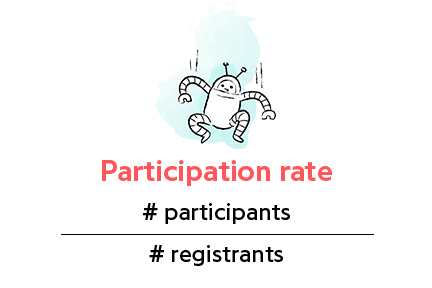
→ The number of registrants / number of participants ratio
If this is low, the marketing automation scenario needs to be reworked. On average, there will be between 40% and 50% of people registered, who will be present on the day of the event. But take advantage of the virtual event by offering your event in replay! Be sure that this method will allow more people to access your event, even if it will not be live. 😉Don't forget to schedule your reminders 1 week and 1 day before the D-day! Don't forget to send the confirmation email to new registrants, thanks to your Eventdrive automation platform.In addition, as this is an online event

The notoriety of your event online on social networks
Here is the type of data that may be interesting to note:
- Number of publications on each network
- Reactions to the publications
- Content of publications
- What types of publications are relayed?
- Did they quote speakers?
- Have they shared photos of them? => UGC
- Was it to complain about the event? => Cold blood!
Do not hesitate to list your results in a table, in order to have an overview of the information collected. 🙂 For this, you can use Airtable which is very easy to use.
Also take into account both positive and negative remarks in order to continuously improve the performance of your online events.
And what could be better than using a tracking tool directly, in order to follow what is being said on the web and on social networks? We love Mention!
The engagement rate of your participants during your online event
As with a physical event, it is important to measure the engagement rate of your participants during your online events. And this is all the more important since the framework of these is very different from the events we are used to. The experience is seen to be different, but the substance remains the same despite everything. 🙂
You will generally have more registrants but a higher no-show rate.
The goal of the various interactivities that you are going to set up is above all to maintain the attention of your participants and to engage them with your company. This is why we recommend the use of an event application in parallel, in order to offer interactivities to your participants. For example, by offering Q&A, quizzes, voting, word clouds, discussion spaces ...
Number of connections
In the context of online events, the number of connections will be determined. If the number of connections is low, this may be due to various factors:
- For example, the quality of your wifi which is not optimal for smooth broadcasting. To remedy this defect, we recommend that you measure your bandwidth and call on an external service provider if necessary. This can also be due to the quality of the wifi of your speakers. In this case, you will not be able to have control over it ...
- Your guests are not very committed: perhaps you should review your communications upstream by sending a reminder email one day before the event, as well as an email a few minutes before your online event, inserting the connection link.
Number of services used
Chat with the number of messages sent in total and per person, how many people took part in the quiz, polls, word clouds, votes ...
Indicators to monitor the satisfaction of your guests
One of the factors of the success of your online event will come straight from the satisfaction of your attendees. And THE main indicator that reveals the success of your event: the NPS!
But what is the NPS? The Net Promoter Score allows you to find out who are able to recommend you.
The question to ask is: "On a scale of 1 to 10, how would you recommend this event to those around you?"
- 9 or 10 = ❤️! Your attendee greatly appreciated your online event! Count on this person to communicate around it. He is therefore considered to be a promoter.
- 7 or 8 = 😶! This is a liability. He remains attentive to the opportunities offered by your competitors.
- Between 0 and 6 = 😱! This person is considered a detractor. Expect to receive negative feedback
Now use the following formula to calculate your Net Promoter Score:
% promoters -% detractors
How to get this data?
Collecting data is all well and good, but have you thought about how you will be able to recover this information? No ? So here are some ideas ... 🙂
Via an event app
Have you ever used an event app? Do you even know what an event app is? If so, hats off!
Thanks to your 100% creative event application, engage with the many interactivities it offers. Among them, the satisfaction questionnaire. Prepare your satisfaction questionnaire in advance and invite your participants to answer it in due time.
Via a survey sent after your online event
Forget paper and pen: remotely, you have to know how to be adaptable! Send them an email a few minutes after the end of your online event to thank your participants, and attach a tracked link that leads to an online form that you have created.
The interesting point in this method is that your participants will be questioned on the spot, so they will have had time to take a step back and be more relevant in their answers.
Do you want to carry out a perfect satisfaction survey? Find our full article for your satisfaction survey right here !
Indicators to calculate the return on investment of your event
After having defined the objectives of your online event, you are able to determine whether your virtual event has benefited from a positive return on investment or not (new customers? Increase in visibility? loyalty of existing customers?).
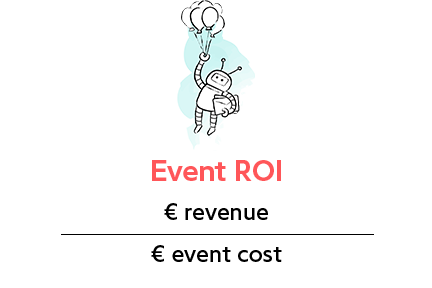
ROI is therefore a basic, one of the main key success factors of your event. To calculate it, nothing could be simpler. Just follow the following formula:
Total revenue generated or to which the event contributed / total expenses

There you have it, you now have all the crucial statistics to measure the success of your virtual events!
If you want to learn more about online events, download our latest comprehensive guide: "How to Create a Virtual Event". You want to know how to create your event online now thanks to Eventdrive Live, ask for your personalized demo !
- Tips (19)
- Virtual events (18)
- Event planning (14)
- Event communication (13)
- Hybrid events (12)
- Event Performance (8)
- Attendee experience (7)
- Seminars (7)
- Eventdrive (6)
- Other (4)
- Year-End Party (4)
- Conferences (3)
- ERG events (3)
- Invitation Management (3)
- Logistics Simplification (3)
- Post-event management (3)
- Team Building (3)
- Event Security (2)
- Event application (2)
- Event trends (2)
- In-person events (2)
- Product Launches (2)
- ROI (1)
- Registration management (1)